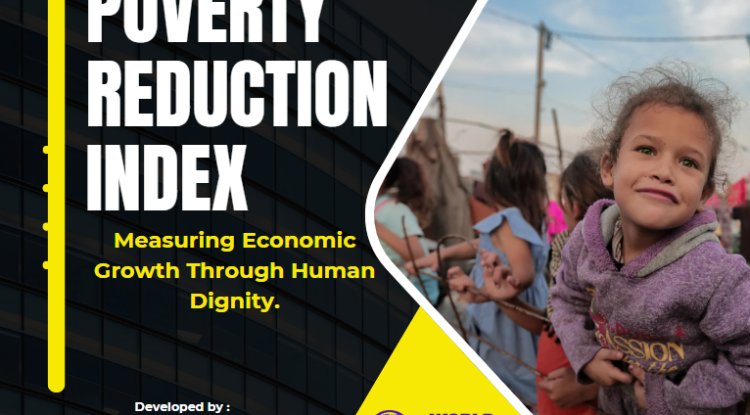
Quantitative Analysis for the Poverty Reduction Index (PRI) as a Tool for Measuring Economic Growth.
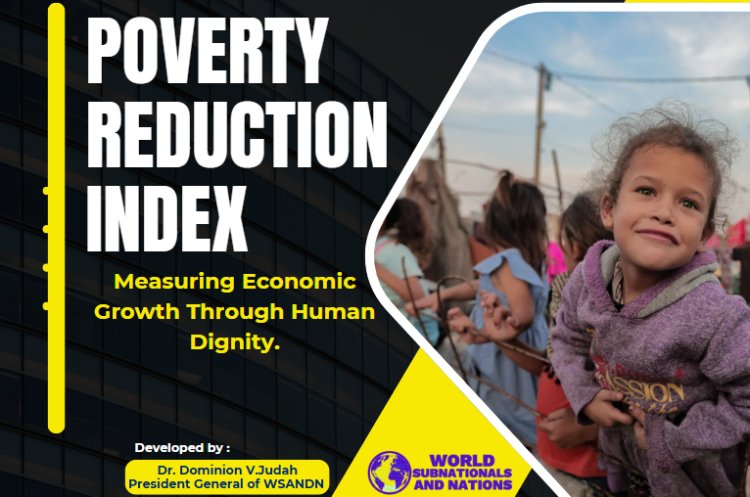


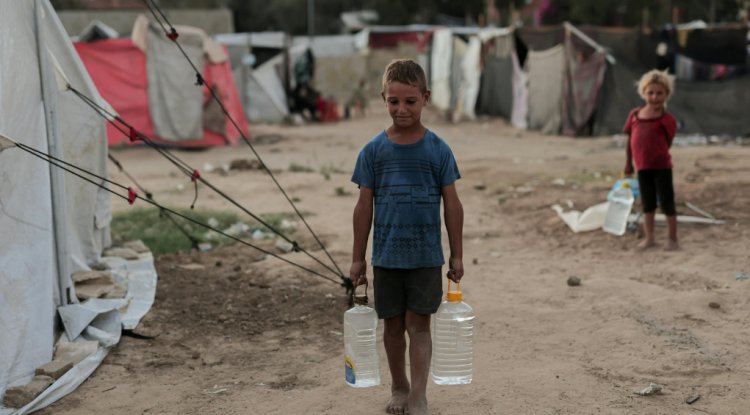
Introduction: The Poverty Reduction Index (PRI) is a proposed composite indicator designed to assess the impact of economic growth on poverty reduction. The PRI quantifies various factors that contribute to the reduction of poverty and provides insights into how growth translates into tangible improvements in the living standards of a population. This analysis considers various economic and social factors, including income distribution, access to basic services, entrepreneurship, and infrastructure.
Key Factors in the PRI:
- Population Earning Minimum $20 Per Day:
- Metric: Percentage of the population earning at least $20 per day.
- Rationale: This indicator reflects the ability of individuals to earn above the poverty threshold and represents the minimum income level required to maintain a basic standard of living.
- Data Needed:
- National average daily income.
- Distribution of income among various population segments.
- Share of the population earning $20 per day or more.
- Living on $5 Per Day:
- Metric: Percentage of the population living on $5 per day or less.
- Rationale: This is a measure of extreme poverty and highlights the number of people who struggle to meet basic living needs.
- Data Needed:
- National poverty line and the percentage of the population living below it.
- Adjusted cost of living based on purchasing power parity.
- Access to Quality Healthcare:
- Metric: Percentage of the population with access to essential health services.
- Rationale: Access to healthcare is critical in reducing poverty by improving health outcomes and enhancing productivity.
- Data Needed:
- Health insurance coverage rates.
- Number of healthcare facilities in rural vs. urban areas.
- Out-of-pocket health expenses as a share of household income.
- Life expectancy and infant mortality rates.
- Quality Education:
- Metric: Enrollment rates in primary, secondary, and tertiary education and graduation rates.
- Rationale: Education is one of the most important drivers of economic mobility and poverty reduction. It equips individuals with skills that enhance employment opportunities and earning potential.
- Data Needed:
- Literacy rates by age group.
- Public vs. private education availability.
- Government spending on education.
- Educational attainment levels (percentage of the population with a high school diploma, bachelor’s degree, etc.).
- Financial Literacy:
- Metric: Percentage of the population with a basic understanding of financial concepts, such as savings, budgeting, investing, and credit.
- Rationale: Financial literacy is important for personal financial management, wealth building, and reducing reliance on high-interest loans or informal financial systems.
- Data Needed:
- Surveys or assessments of financial literacy.
- Availability of financial education programs.
- Usage of financial products (bank accounts, insurance, etc.).
- Entrepreneurship Increase:
- Metric: Number of new businesses or startups established annually.
- Rationale: Entrepreneurship plays a vital role in creating jobs, boosting innovation, and increasing economic activity, all of which contribute to poverty reduction.
- Data Needed:
- New business registrations.
- Access to startup capital (microfinance, venture capital).
- Growth in small and medium-sized enterprises (SMEs).
- Transportation Infrastructure:
- Metric: Accessibility of transportation (roads, public transit) for the majority of the population, particularly in rural areas.
- Rationale: A strong transportation system reduces the isolation of communities, facilitates the movement of goods, and creates job opportunities, all of which contribute to economic growth and poverty alleviation.
- Data Needed:
- Road density and coverage (both urban and rural).
- Public transport access rates.
- Average travel time to the nearest market, school, or healthcare facility.
- Number of New Jobs:
- Metric: Increase in employment opportunities over a defined period.
- Rationale: Job creation is one of the most direct ways to reduce poverty. More jobs mean higher incomes and reduced unemployment.
- Data Needed:
- Labor force participation rates.
- Unemployment rates.
- Job creation rates by sector (agriculture, manufacturing, services).
- Affordability of General Living Standards:
- Metric: Housing affordability, cost of utilities, and general cost of living as a percentage of income.
- Rationale: For poverty reduction to be sustainable, the general cost of living must be manageable for the majority of the population.
- Data Needed:
- Housing costs (rent or mortgage rates).
- Utilities costs (electricity, water, internet).
- Cost of basic food items.
- Median household income.
Quantitative Calculation of PRI:
The PRI can be computed as a weighted average of these indicators, with each factor contributing differently based on its perceived importance for poverty reduction. The general formula for PRI would be:
PRI=w1⋅P1+w2⋅P2+w3⋅P3+…+wn⋅PnPRI = w_1 \cdot P_1 + w_2 \cdot P_2 + w_3 \cdot P_3 + \ldots + w_n \cdot P_nPRI=w1⋅P1+w2⋅P2+w3⋅P3+…+wn⋅Pn
Where:
- PiP_iPi represents the percentage or ratio associated with each factor (e.g., percentage of the population earning $20/day, access to healthcare).
- wiw_iwi represents the weight assigned to each factor based on its perceived importance in reducing poverty (sum of weights = 1).
Example:
Assume we have the following weights and data for a country:
- w1w_1w1 (Population earning $20/day or more) = 0.2
- w2w_2w2 (Living on $5/day) = 0.15
- w3w_3w3 (Access to quality healthcare) = 0.1
- w4w_4w4 (Quality education) = 0.15
- w5w_5w5 (Financial literacy) = 0.1
- w6w_6w6 (Entrepreneurship) = 0.1
- w7w_7w7 (Transportation infrastructure) = 0.1
- w8w_8w8 (Number of new jobs) = 0.05
- w9w_9w9 (Affordability of living standards) = 0.05
The values of the respective factors might be as follows:
- Population earning $20/day or more: 50% (P1)
- Living on $5/day: 30% (P2)
- Access to healthcare: 80% (P3)
- Quality education: 60% (P4)
- Financial literacy: 40% (P5)
- Entrepreneurship increase: 5% growth annually (P6)
- Transportation infrastructure: 70% accessibility (P7)
- Number of new jobs: 3% increase annually (P8)
- Affordability of living standards: 70% (P9)
Calculating PRI:
PRI=0.2⋅50+0.15⋅30+0.1⋅80+0.15⋅60+0.1⋅40+0.1⋅5+0.1⋅70+0.05⋅3+0.05⋅70PRI = 0.2 \cdot 50 + 0.15 \cdot 30 + 0.1 \cdot 80 + 0.15 \cdot 60 + 0.1 \cdot 40 + 0.1 \cdot 5 + 0.1 \cdot 70 + 0.05 \cdot 3 + 0.05 \cdot 70PRI=0.2⋅50+0.15⋅30+0.1⋅80+0.15⋅60+0.1⋅40+0.1⋅5+0.1⋅70+0.05⋅3+0.05⋅70 PRI=10+4.5+8+9+4+0.5+7+0.15+3.5=46.65PRI = 10 + 4.5 + 8 + 9 + 4 + 0.5 + 7 + 0.15 + 3.5 = 46.65PRI=10+4.5+8+9+4+0.5+7+0.15+3.5=46.65
The PRI score would then be scaled appropriately (e.g., out of 100) to interpret the country’s overall progress in poverty reduction.
Interpretation:
- PRI Score Close to 100: Indicates significant poverty reduction and economic growth, with widespread improvements in income, access to services, and affordability.
- PRI Score Near 50: Reflects moderate poverty reduction with some progress in key areas, but gaps remain, especially in sectors like education, healthcare, or entrepreneurship.
- PRI Score Close to 0: Reflects a lack of progress, where poverty remains widespread, and economic growth has not translated into significant improvements in living standards for most of the population.
Conclusion:
The PRI serves as a valuable tool for assessing how economic growth affects poverty reduction. By considering a broad range of indicators such as income, access to healthcare, education, and job creation, the PRI provides a holistic view of a nation's development and its impact on poverty. It can help policymakers identify key areas for intervention and track progress toward reducing poverty over time.